Home About Services Work Blog Contact Apply Now →
Live Events & Concerts

India's Concert Economy: How We Use Performance Marketing to Fill Shows for Dr. Satinder Sartaaj

Sannidhya Baweja
November 2026
13 min read

TL;DR

  • Concerts in India are now a real economy. Live events grew 44% in 2025, faster than any other part of Indian media and entertainment.
  • A concert ticket is a product with an expiry date. Once the show starts, every empty seat is lost forever. That changes how you should run ads.
  • We run performance marketing for Dr. Satinder Sartaaj's tours. Last international season that meant more than 2.5 lakh tickets across 30+ shows on three continents.
  • The four changes that mattered most: optimise for buyers instead of clicks, send real ticket sales back to Meta, sell the artist instead of the event theme, and plan every city's budget backwards from its seats.
  • We run the whole tour from a live dashboard that tracks seats sold, days left and how much of the ticket money goes to ads, for every city. Screenshots inside, with the numbers blurred, plus one example chart with made-up numbers.
  • The biggest lever is the last seven days. Last season, sales jumped 2 to 5 times in the final week while the cost of each ticket fell by around 40%.

If you sell tickets for concerts, tours or live shows, this post is for you. I am going to show you what the concert economy actually is, why it needs a different kind of ad strategy, and exactly how we sell tickets for one of the biggest names in Punjabi and Sufi music.

No theory. This is the system we run every day, with the numbers kept rounded so nothing confidential leaves the room.

What Is the "Concert Economy"?

The concert economy is all the money that moves because a show happens. It is not just tickets. It is the train or flight a fan takes to reach the city, the hotel room, the dinner before the show, the cab home, the merchandise and the brands that pay to put their name on the stage.

India has woken up to this in the last two years. Three numbers show how big it has become:

  • Coldplay in Ahmedabad. Two shows in January 2025 drew more than 2.2 lakh people and created an estimated ₹641 crore of economic impact. Fans spent around ₹585 in the city for every ₹100 they spent on tickets.
  • Diljit Dosanjh's Dil-Luminati tour. The India leg played 13 cities to about 3.2 lakh fans and generated an estimated ₹943 crore of economic impact.
  • The whole industry. Live events grew 44% in 2025 and became the fastest-growing part of Indian media and entertainment. In 2024, India already had 70 to 80 concert days with crowds of more than 10,000 people.

These are estimates from reports made with the industry, so treat them as direction rather than audited fact. But the direction is very clear. People are travelling across states to watch an artist live, and they are spending serious money to do it.

Here is why this matters to you: when that much demand exists, the shows that sell out are not always the shows with the biggest artist. They are the shows that reach the right fans, in the right city, at the right moment before the date. That is a performance marketing problem.

Why Selling Concert Tickets Is Different From Selling Anything Else

Most brands we work with sell a product that waits on a shelf. If a skincare brand has a slow week, the bottle is still there next week.

A concert ticket does not work like that. It has three things that make it harder:

  1. It expires. When the lights go down, an unsold seat is gone forever. You cannot discount it next month.
  2. Every city is its own business. A tour of 30 cities is really 30 separate launches, each with its own crowd, its own ticket price and its own deadline.
  3. Demand comes in waves. There is a rush when tickets go live, a slow middle stretch, and then a second rush right before the show.

So the normal ad playbook, where you find a winning ad and slowly raise the budget, is too slow. You need a plan for each city that knows how many seats are left and how many days are left.

Who We Work With: Dr. Satinder Sartaaj

Dr. Satinder Sartaaj is a Punjabi Sufi singer, poet and actor with fans across India, North America, Australia and the Middle East. His audience is loyal and spread out. Many fans will travel to another city to see him.

We run the performance marketing for his tours, working alongside his tour and promotion team. Across the last international season, that work looked like this:

  • More than 2.5 lakh tickets sold.
  • 30+ shows across three continents: Australia, the United States and India.
  • At peak, thousands of tickets a day.
  • In some US cities, the cost of selling one ticket came in under $5.

Right now we are working on his India tour for this season, The Philosophy of Resonance Tour, which runs across 31 Indian cities. On launch day alone, more than a thousand tickets sold.

How We Sell Concert Tickets With Performance Marketing: The 7-Step System

Now obviously, those numbers do not appear out of thin air. There is a process behind them. Here it is, step by step.

Step 1: Stop paying for clicks. Pay for buyers.

Most concert ads we audit run on Meta's "Traffic" goal. That tells Meta: find me people who will click. Meta is very good at that. The problem is that clickers and buyers are different people.

So we switched the goal to "Initiate Checkout". That is the moment a fan picks seats and starts paying. Now Meta looks for people who behave like buyers, not people who like tapping on things.

What to do: open your ticket campaigns and check the goal. If it says Traffic, Reach or Engagement, your money is buying attention, not tickets.

Step 2: Tell Meta who actually bought a ticket.

Meta can only find more buyers if it knows who your buyers were. Most ticketing websites do not pass that information back properly, so Meta is guessing.

We set up a server connection called the Conversions API. In plain words, it is a direct line from the ticket sales data to Meta. Every 30 minutes it sends the real purchases back. We also connected an attribution tool, so we could see which ad led to which sale instead of trusting one dashboard.

What to do: ask your ticketing partner or developer one question. "Are our purchases being sent to Meta from the server, or only from the browser?" If they do not know the answer, that is your first fix.

Step 3: Sell the artist, not the event theme.

It is tempting to market the occasion. A New Year's Eve show, a festival night, a special venue. We learned the hard way that fans do not come for the theme. They come for him.

So every ad leads with the artist. The theme is a supporting detail, never the headline. We use the songs fans already love to grab attention, and we test newer songs on small budgets before we put real money behind them. We also use only official footage and approved photos, which keeps the artist's image consistent everywhere.

What to do: look at your last five concert ads. If the artist's face and best-known song are not in the first two seconds, change that first.

Step 4: Make every ad feel local.

A fan in Melbourne, a fan in Dubai and a fan in Jaipur are not the same person. The same ad will not land the same way with all three.

So we change the ad for each market. The language, the emotion, the line on the poster, even the font. For the Dubai show, we used Urdu lettering on the creative because that is what that audience reads and feels connected to.

What to do: make at least one version of your main ad for each language your audience speaks. Start with the city that has the most unsold seats.

Step 5: Plan each city's budget backwards from its seats.

This is where most people get lazy. They set one budget for the whole tour and hope it spreads out evenly. It never does.

We treat every city as its own campaign with its own target. The plan starts from the venue: how many seats are there, how many are sold, and how many days are left. From that we work out how many tickets we need to sell each day, and the budget follows that number.

We also scale smaller cities and big metros differently. In smaller cities, demand jumps up and down, so we push budget early while the buzz is there. In big metros, demand is steadier, so we can scale later and more calmly.

What to do: make a simple sheet with one row per show. Add seats, seats sold and days left. Divide the unsold seats by the days left. That is how many tickets you need every day. Now you know which city needs money first.

Step 6: Save your firepower for the last seven days.

This is the single biggest lesson from last season. In the final week before each show, ticket sales went up 2 to 5 times. And even though we were spending much more, the cost of each ticket actually fell by around 40%.

Why? Because that is when fans who were "thinking about it" finally decide. The ads are no longer convincing anyone the show exists. They are just reminding people who already want to go.

So now our plan is simple. We run a steady daily budget until eight days before a show. Then, for the last seven days, we raise the daily budget to around two and a half times what it was.

What to do: do not spend your whole budget in the first two weeks. Hold a big share back for the final seven days before every date.

Step 7: Watch it every hour, in the venue's time zone.

When you are close to a show, a day is too long to wait for data. If an ad stops working at 11 am, you want to know by noon.

So we built a live dashboard that tracks sales and ad spend for every city. It reports by the hour, in the time zone of the venue, not ours. It also takes the sales tax out of ticket revenue, whatever the country calls it: GST in India and Australia, VAT in the UK and Europe, sales tax in the US. That way we compare what the show truly earns against what the ads truly cost. Skip this one fix and revenue looks bigger than it really is, by 18% on most tickets in India and 20% in the UK.

What to do: whatever report you use, make sure revenue is shown without tax before you compare it to ad spend.

Inside the Dashboard We Built to Run the Tour

Every step above needs one thing to work: knowing, every day, where each show stands. A spreadsheet with 30 tabs cannot tell you that fast enough. So we built a live dashboard for this tour. The first three screenshots below are from the real thing. We have blurred and scrambled every number, because the figures belong to the artist's team. The last chart is an illustrative example with made-up numbers, because this season is still on sale. What you can still see is how we read a tour.

1. One number for the whole tour: how much of the ticket money goes to ads

The dashboard is built around a single number. It is the ad spend for a city divided by that city's ticket revenue, with the sales tax taken out. Each city gets its own limit for this number, because a new city costs more to break into than a city where fans already know the artist. Green means there is room to spend more. Yellow means the city is getting close to its limit. Red means it has gone over.
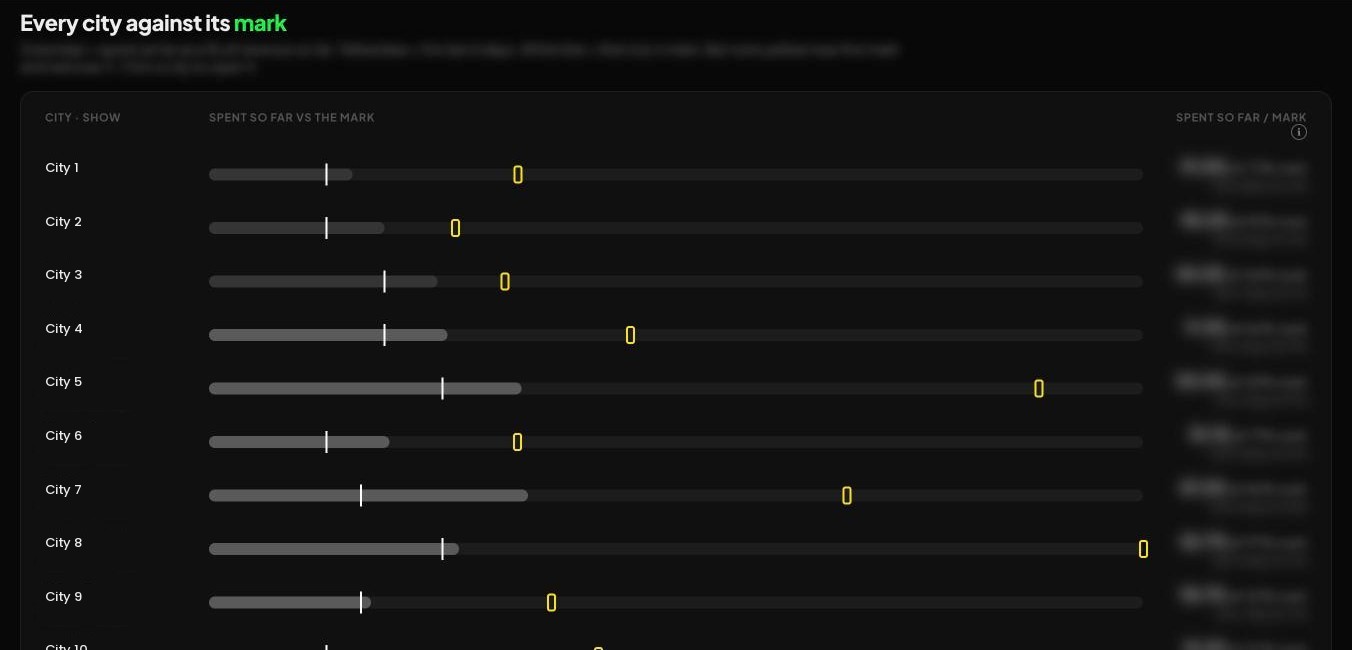
Tour overview: every city compared against its own ad-spend limit, numbers blurred
Every city on one screen. The bar is what has been spent so far, the white line is that city's limit, and the yellow marker is the last seven days. City names replaced, numbers blurred and scrambled.

2. Pacing: seats sold against days left, for every show

For each city, the dashboard shows how many seats exist, how many are sold, how many are held back for guests and sponsors, and how many are still open. It puts that next to the number of days left before the show. That tells us how many tickets the city needs to sell each day from here, which is the number that decides its budget.
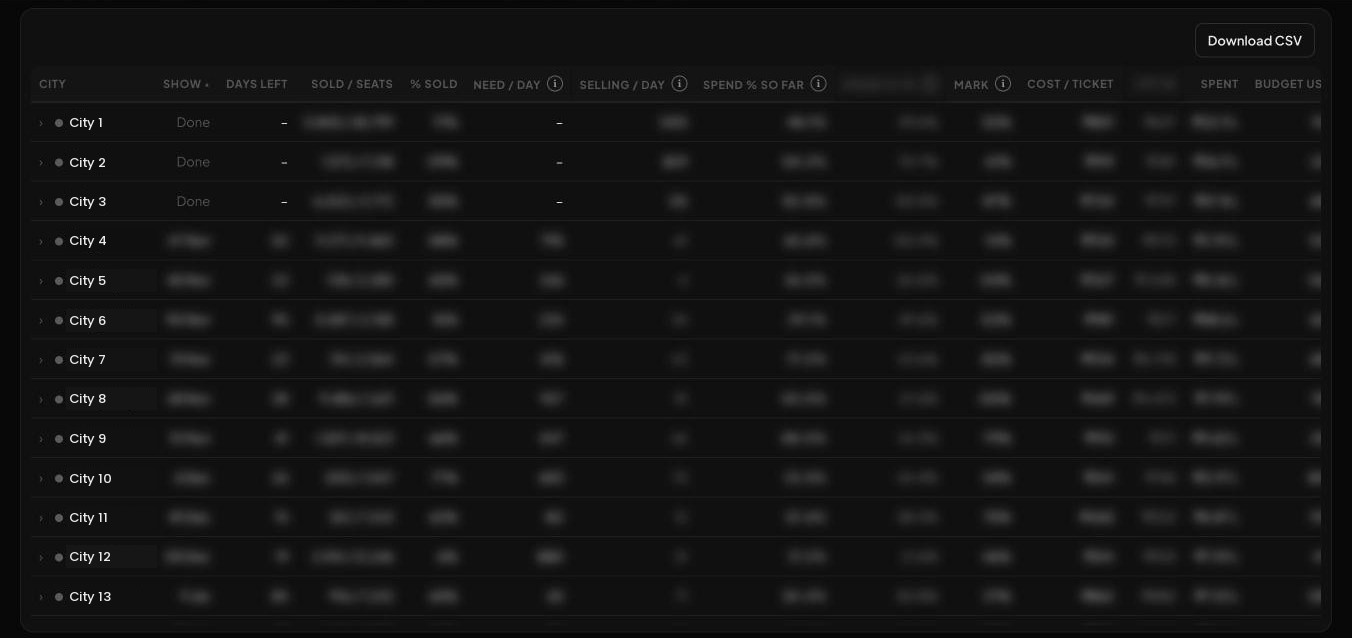
Pacing table for every show: seats sold, days left and tickets needed per day, numbers blurred
Pacing for every show: seats sold, days left, and how many tickets each city needs per day. City names replaced, numbers blurred and scrambled.

3. The daily trend: tickets per day and cost per ticket

Two charts get checked every morning. Tickets sold per day shows whether a city is speeding up or slowing down. Cost per ticket shows whether the ads are still working. We read the cost of a click, the cost of showing the ad and the click-through rate together, because together they tell us whether the problem is the picture, the message or the audience.
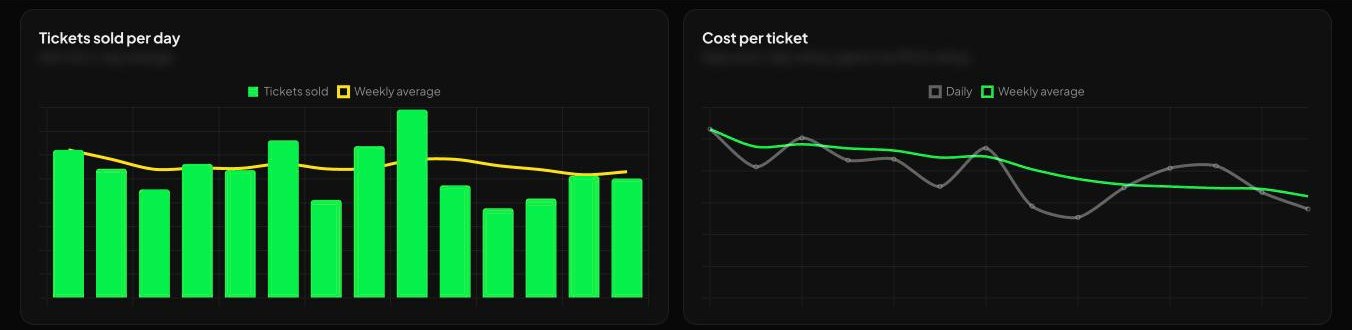
Daily tickets sold and cost per ticket charts, numbers hidden
Daily tickets and cost per ticket. The shape is real; the numbers are hidden.

4. Every show has a stage, and every stage has a job

The dashboard also labels each show by where it is in its run. Early is more than three weeks out. Middle is one to three weeks out. Then comes the final week, and then done. Each stage comes with a one-line instruction for the team, so nobody has to guess what to do with a city today. It also flags shows with no fresh ads running, days where the sales sheet was not filled in, and cities where Meta is seeing far fewer purchases than were actually sold.

5. This season against last season

Because we ran last season too, the dashboard puts this season's sales next to last season's for every city that is coming back. That is how we know when a city is truly behind and when it is just early. It is also where the final-week rule from Step 6 came from.

This season is still selling, so the real chart changes every day. The one below uses made-up numbers to show what you are looking for: green bars passing the grey ones means a city has already beaten last season, and the gap to the yellow bar is the seats still left to sell.
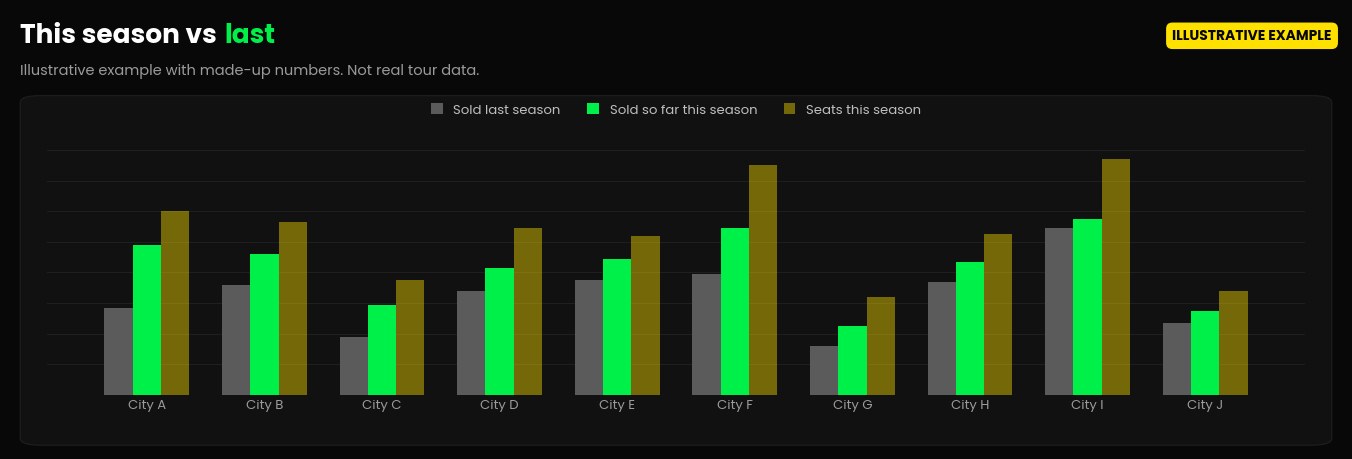
Illustrative example: tickets sold this season against last season, city by city, made-up numbers
Illustrative example with made-up numbers, not real tour data. Grey is last season, green is this season so far, yellow is the seats on sale.

The dashboard refreshes on its own, and decisions from our calls with the artist's team flow into it automatically. The team that runs the ads works from a second view built for them. It shows only what they need to act on: which ads to scale, which to switch off and which cities need new creative. An ad only counts as a winner there once it has spent enough, brought in several purchases and beaten that city's own average by a clear margin.

What to do: you do not need a custom build to start. Put one row per show in a sheet: seats, sold, days left, ad spend and revenue without tax. Add one column for spend divided by revenue, and give every city its own limit. Colour it green, yellow and red. That alone will change which city you spend on tomorrow.

A Real Example: Selling Out Melbourne in 13 Days

Here is what this system looks like under pressure.

Thirteen days before a Melbourne show, most of the seats were still unsold. The brief from the artist's team was one line: sell it out.

So we did three things. First, we worked out how many tickets had to sell every single day to fill the room, and set the budget from that number. Second, we switched to hourly reporting on Melbourne time, so every slow hour got a response the same day. Third, we pushed hardest in the final week, exactly as Step 6 says.

The room filled. That was the whole point. Not a nice-looking click-through rate. A full house, on the night.

The Second Engine of the Concert Economy: Sponsorships

Ticket sales are only half the story. The other half is brands paying to be part of the show.

Here is the important part. A fan and a sponsor want completely different things, so they need completely different ads.

  • Fans want emotion. The voice, the songs, the memory of a night out.
  • Sponsors want reach and proof. How many people, what kind of people, and how the brand will be seen.

So for sponsorship we run a separate campaign aimed at senior decision-makers in companies, not at fans. The ads are plain and serious, almost like a document. The message is simple: this tour puts your brand in front of lakhs of loyal, high-spending fans across a season. It leads to a separate sponsorship page, not the ticket page.

Mixing the two is a common mistake. If your sponsor pitch looks like a fan video, a brand manager will scroll straight past it.

The Numbers Every Concert Promoter Should Track

If you only track four numbers, track these. Each one tells you something different.

  1. Cost per ticket. Total ad spend divided by tickets sold. This is your real cost. Ignore cost per click.
  2. Checkout rate. Of the people who start checkout, how many finish paying. If this is low, the problem is your ticket page, not your ads.
  3. Sell-through by days left. The percentage of seats sold, for each city, compared with how many days are left. This tells you which city needs help today.
  4. Revenue without tax versus ad spend. The honest answer to "is this show making money from ads?"

What to Do This Monday Morning

If you run concerts or tours, here is a list you can finish in one morning:

  1. Check the goal on every ticket campaign. Switch Traffic campaigns to a purchase or checkout goal.
  2. Ask your developer whether ticket purchases are sent to Meta from the server. If not, book that fix this week.
  3. Build the one-row-per-show sheet from Step 5, and find the show that needs the most tickets per day.
  4. Pull your budget plan and make sure a big share is saved for the last seven days before each date.
  5. Look at your top three ads. The artist and their best-known song should be in the first two seconds.

Frequently Asked Questions

How much does it cost to sell one concert ticket with Facebook and Instagram ads?

It depends on the city, the ticket price and how well known the artist is in that market. For Dr. Satinder Sartaaj's tours, our best US cities came in under $5 per ticket. The bigger point is that your cost per ticket drops sharply in the final week, so judge it across the whole run, not on day three.

When should I start running ads for a concert?

Start the day tickets go live, because the first rush is real. Then keep a steady, smaller budget through the middle weeks, and raise it sharply for the last seven days before the show.

Should I use Meta ads, Google ads or Spotify?

Meta (Facebook and Instagram) does most of the ticket selling for us, because it lets us reach fans by interest and city and optimise for buyers. Google helps catch people already searching for the show. We are now exploring audio platforms like Spotify to build awareness in brand-new cities, where fans need to hear the artist before they will buy a ticket.

Do I need a big budget to use this system?

No. The steps work at any size. A small show with a small budget still benefits from buying for checkouts, sending sales back to Meta and saving money for the final week. The budget changes. The method does not.

Want Us to Look at Your Tour?

If you are an artist, a tour manager or a promoter, and you want your next show to sell out instead of just getting clicks, we can help. We have done this across three continents, for one of the most loved voices in Punjabi music.

Book a discovery call here and we will look at your current ticket campaigns together. You will leave knowing exactly what to fix first.

Sources: EY-Parthenon and BookMyShow Live, Coldplay Ahmedabad impact report (April 2025) · EY, Dil-Luminati India Tour 2024 impact report (March 2026) · FICCI-EY Media and Entertainment Report 2026, via Storyboard18 · EY-Parthenon, India's Rising Concert Economy. Tour figures are Baweja Media's own campaign data, rounded.

Now Accepting New Clients

Profitable
ROAS.
Every Time.

Baweja Media runs Facebook Ads and Google Ads for businesses that demand one thing: profitable ROAS. Not vanity metrics. Not impressions. Real, predictable returns across the UK, US, Canada, India, Australia & GCC — backed by $125M+ in managed ad spend across healthcare, finance, e-commerce, and high-ticket services.

Scroll to explore
business.facebook.com / Ads Manager
Campaigns
Ad Sets
Ads
Reports
Total Spend
£5.2M+
↑ Across 3 Markets
ROAS
2.65×
↑ vs 1.1× prev
Avg CPL (UK)
£14
↑ 40% below target
Leads Generated
274K+
↑ UK Account
Campaign
Spend
CPL
ROAS
UK Claims · Broad A1
£105K
£11
£10.98
Twin Birds · Retarget
$82K
$380
3.4×
D2C Brand · PMax
$24K
$18
3.2×
ads.google.com / Campaigns — Performance
Overview
Campaigns
Keywords
Conv. Value / Cost
3.2×
↑ vs 2.5× target
Cost / Conv.
$312
↓ 40% vs prev
Conversions
2,418
↑ 89%
Live ROAS
2.65×
IN · Fashion Brand
↑ On Target
Cost Per Lead
£14
UK · Claims Campaign
↓ 40% Below Target
Total Ad Spend Managed
$125M+
IN · UK · US · CA · GCC
↑ Since 2014
$125M+
Ad Spend Managed
10+
Years Experience
8-Fig
Client Revenues Driven
4
UK · US · CA · IN · AU · GCC
What We Do

One focus.
Extraordinary execution.

One focus: profitable ROAS for every client. We don't chase clicks or impressions — we build campaigns that pay back more than they cost.

Facebook & Meta Ads

We build full-funnel Facebook and Instagram campaigns that deliver profitable ROAS — not just traffic. Cold prospecting, dynamic retargeting, lead generation, and e-commerce scaling. Across India, UK, US, Canada & GCC.

Campaign architecture & funnel strategy
Creative testing & winner identification
Audience strategy: cold, warm & retargeting
Lead gen, e-commerce, B2B — all verticals
See full service

Google Ads

Search, Shopping, and Performance Max campaigns built to capture high-intent buyers at the exact moment they're ready to convert. No wasted spend. No guessing. Just profitable acquisition.

Search, Shopping & Performance Max
Keyword strategy & negative keyword architecture
Landing page strategy for Quality Score
Smart bidding & conversion optimisation
See full service
Featured Work

Real campaigns.
Real numbers.

View All Work
£14
Avg CPL
274K+
Leads
£5.2M
Managed
7yr+
Partnership
UK Claims · Finance Lead Gen

UK Claims Company — Enterprise Facebook Lead Gen

£14 avg CPL · 274,000+ leads · £5.2M+ managed across multi-account structure

+1,069%
Procedures Growth
$91K/mo · US Cosmetic Surgery
Healthcare · US

US Cosmetic Surgery — +1,069% Procedures Booked

$145 per procedure · +506% consultations · -92% acquisition cost · $91K/mo spend

$1.5M
Monthly Budget Managed
Scaled from $50K · 3,860% growth
High-Ticket · Scale

Career Coaching Firm — $50K to $1.5M/Month

3,860% budget scale · 30+ simultaneous ad templates · controlled CPA throughout

Trusted by
Leadly
OutSpark · by Times of India
Naava
Crystalicious
Satinder Sartaaj
Kass Care
Level Up For Women
Swastik Nandakumar
MBG Card
Maharishi Ayurveda
Yash Vardhan Swami
Leadly
OutSpark · by Times of India
Naava
Crystalicious
Satinder Sartaaj
Kass Care
Level Up For Women
Swastik Nandakumar
MBG Card
Maharishi Ayurveda
Yash Vardhan Swami
Face Clinics
Use Me Works
Taylor & Francis
Praana
Jaey
Andrew Mellen
Growdent
Viral Chilly
Beasyfit
IACG
Loaneo
Face Clinics
Use Me Works
Taylor & Francis
Praana
Jaey
Andrew Mellen
Growdent
Viral Chilly
Beasyfit
IACG
Loaneo
Let's Work Together

Ready for ads that
deliver profitable ROAS?

Apply to work with Baweja Media. We review all applications within 48 hours.

Our Story

We built this agency to prove that performance marketing can be done right.

From a single ad account to $125M+ in managed spend — this is the Baweja Media story.

The Foundation

Engineer by training.
Marketer by obsession.

Sannidhya Baweja didn't start in marketing. He started as an engineer — trained to think in systems, find patterns, and solve problems methodically. When he discovered performance advertising, he brought that engineering precision to ad accounts. The results were extraordinary.

Over 10+ years, Sannidhya has managed over $125M in ad spend across e-commerce brands, coaching businesses, and lead generation companies in India, the UK, and the United States — with clients across e-commerce, B2B, SaaS, and lead generation.

Before recommending any strategy to a client, we test it on our own brands first. That's the Baweja Media standard — and the reason our results are consistently exceptional.

Work With Us
10+
Years in Performance Marketing
$125M+
Ad Spend
8-Fig
Revenues Driven
3
Markets
∞
Industries
Why We Exist

Mission & Vision

Our Mission

To deliver performance marketing results that are measurable, consistent, and meaningful — for every business, in every industry, at every scale. We exist to make paid advertising the most reliable growth engine for our clients.

🔭

Our Vision

To be the most trusted performance marketing agency in the world — known not for the size of our client list, but for the depth of our results. We want every business that works with us to say we were the best investment they ever made.

The Team

The people behind the results.

A focused team of performance marketing practitioners — trained, trusted, and obsessed with ROAS.

Sannidhya Baweja

Sannidhya Baweja

Founder & CEO

Performance marketing expert with 10+ years and $125M+ in managed ad spend across the UK, US, Canada, India, Australia & GCC. Creator of the IROF framework. 50K+ subscribers on YouTube.

Sonia Suraliya

Sonia Suraliya

Co-Founder & COO

Strategic operations leader and Co-Founder of Trackocity. Oversees client delivery, team systems, and content strategy at Baweja Media. Background in economics and digital marketing.

4.8×
Avg ROAS
−31%
CPA Drop
$125M
Ad Spend
SB
SS
MK
+7
Performance Specialists

Performance Team

Ads Management & Creative

Trained directly in our proprietary IROF framework. Specialists across Meta Ads, Google Ads, and performance creative — not generalists. Every account gets senior attention.

Core Values

What we stand for.

01

Data Over Gut

Every decision we make is backed by numbers. We test, we measure, we act on evidence — never on assumptions.

02

Radical Transparency

You always know exactly where your money is going and what's happening with it. No jargon. No hiding behind metrics.

03

ROAS Is Everything

We don't celebrate impressions or vanity metrics. We celebrate one thing: profitable returns on every pound, dollar, and rupee you invest.

04

Practise What We Preach

We test every strategy on our own brands before recommending it to clients. Real expertise comes from real experience.

Services

Performance marketing.
Every industry. Every scale.

We are not a generalist agency. We do one thing — build campaigns that deliver profitable ROAS — and we go deeper than anyone else.

$125M+ managed on Meta

Meta & Facebook Ads

The most powerful paid social channel for lead generation and e-commerce — when run by people who actually understand it. We build campaigns that compound, not just campaigns that spend.

For Lead Gen E-Commerce High-Ticket Healthcare
  • Full account audit + cold/warm/hot campaign architecture
  • Creative strategy, ad copy, and scroll-stopping hooks
  • Retargeting sequences and lookalike audience build-out
  • Pixel, CAPI, and conversion event tracking
  • Daily budget management and ROAS optimisation
$18 SaaS trial cost · 3.2× D2C ROAS

Google Ads

Search, Shopping, YouTube, and Performance Max. We capture buyers who are already looking for you — and we cut the 70%+ of spend that typically goes to waste.

For E-Commerce SaaS Local Services B2B
  • Keyword research with surgical negative keyword strategy
  • Search, Shopping, and Performance Max campaigns
  • Bid strategy optimisation tied to actual profitability
  • Google Tag Manager and GA4 conversion tracking
  • Monthly reporting with real insight, not vanity metrics
45K+ leads/month for insurance

Lead Generation Systems

Not just ad clicks — a complete end-to-end system that generates qualified leads at scale. From the ad to the form to the CRM handoff, every step is engineered to convert and qualify.

For Finance & Insurance Healthcare Coaching B2B
  • Multi-channel lead gen strategy (Meta + Google)
  • Lead form design with qualification filtering
  • CPL benchmarking and cost reduction roadmap
  • Lead quality scoring and CRM integration
  • Retargeting for non-converting leads
3.4× ROAS at $25K/day spend

E-Commerce & D2C Growth

From your first £5K month to scaling past 8 figures. We run paid ads for D2C and Shopify brands that need real ROAS — not agency-padded numbers — across fashion, nutraceuticals, luxury, and more.

For Shopify Brands D2C Fashion Luxury
  • Prospecting + retargeting for every funnel stage
  • Product feed and catalogue optimisation
  • AOV and LTV-based bidding strategy
  • Seasonal and launch campaign management
  • Scaling frameworks tied to margin, not just revenue
30+ winning ad templates · $1.5M/mo

Performance Creative

Creative is the single biggest lever in paid media — and most brands get it wrong. We write the briefs, develop the concepts, test at scale, and iterate until we find what makes your audience act.

For Brands Running Ads High-Ticket Coaching D2C
  • Hook writing for video, static, and carousel ads
  • Ad copy and headline development from performance data
  • Creative brief writing for your design or video team
  • Systematic A/B testing and winner identification
  • Competitor creative audits and angle analysis
$50K → $1.5M/mo without ROAS break

Scaling & Profitability

Already running profitable ads and want to grow? We build the scaling roadmap — identifying which campaigns to feed, which to kill, and exactly how to add budget without burning efficiency.

For Profitable Brands Ready to Scale £10K+/mo Spend
  • Profitability audit — margin vs ROAS analysis
  • Budget allocation framework across channels
  • Scaling triggers and guardrails to protect efficiency
  • Attribution stack review and true profit measurement
  • Weekly scaling calls and real-time decision support
How We Work

Our Process

1

Audit

We dissect your current accounts, funnels, and data to understand exactly what's working and what isn't.

2

Strategy

We build a tailored campaign strategy based on your goals, audience, and competitive landscape.

3

Execute

We launch, test, and iterate — with daily monitoring and rapid decisions backed by real-time data.

4

Scale

We find what's working and scale it profitably — increasing budget where it makes sense, pulling where it doesn't.

Get Started

Not sure which service
is right for you?

Apply and we'll figure it out together. We'll review your business and recommend the exact approach that makes sense.

Apply to Work With Us
Our Work

Results that speak
for themselves.

Real campaigns, real clients, real numbers. No case studies written to impress — just the data.

£14
Avg CPL
274K+
Leads
£5.2M
Ad Spend
7yr+
Partnership
Finance · Lead Gen

UK Claims Company — Enterprise Lead Generation

Facebook Ads · Multi-Account · £5.2M+ Spend

£14 CPL 274K+ Leads £5.2M Managed
VIEW CASE STUDY →
Industry Avg
£20
benchmark before us
Our Average
£12
-40% · 5yr partnership
Car Finance · Lead Gen

UK Car Finance — 5-Year Lead Generation Partnership

Facebook Ads · £100K+/Month · 5 Years

£12 Avg CPL -40% vs Benchmark £15 Per Approval
VIEW CASE STUDY →
£11
CPL
8,200+
Apps/Month
67%
Approval Rate
-60%
CPL Reduction
Personal Loans

UK Personal Loans — 8,200+ Applications/Month

Facebook Lead Gen · Qualification Funnel · £11 CPL

£11 CPL 8,200+ Apps/Mo 67% Approval Rate
VIEW CASE STUDY →
£34
CPL
12.4K+
Applications
58%
Lead→App Rate
18mo
Campaign
Mortgage · Lead Gen

UK Mortgage Brokers — 12,400+ Qualified Applications

Facebook Lead Gen · FTB · Remortgage · Buy-to-Let · 18 Months

£34 CPL 12,400+ Applications 58% Lead-to-App Rate
VIEW CASE STUDY →
45K+
Leads/Month
£5
Car Ins. CPL
£17
Life Ins. CPL
3yr
Partnership
Insurance · Lead Gen

UK Insurance Lead Gen — 45,000+ Leads/Month

Car · Life · Home Insurance · Facebook · 3-Year Partnership

45K+ Leads/Mo £5 Car CPL £17 Life CPL
VIEW CASE STUDY →
Cost Per Consult
-56%
acquisition cost slashed
High-Ticket Cases
+408%
implant case volume
Healthcare · High-Ticket

UK Dental Implants — High-Ticket Case Volume

Facebook Ads · £74,987/Mo Spend · Premium Healthcare

+408% High-Ticket Cases -56% Cost Per Consult 69.5% Show-Up Rate
VIEW CASE STUDY →
+1,069%
Procedures Growth
$91K/mo · US Cosmetic Surgery
$145 per procedure
High-Ticket · Healthcare

US Cosmetic Surgery — 1,069% Procedures Growth

Facebook & Google Ads · $91K/Mo · United States

+1,069% Procedures $145 Per Procedure +506% Consultations
VIEW CASE STUDY →
+271%
Consultations
77.8%
Contact Rate
+49%
Show-Up Rate
AU
Market
Healthcare · Australia

Australian IVF Clinic — 3× Consultations Attended

Facebook Ads · Lead Infrastructure · Australia

+271% Consultations 77.8% Contact Rate +49% Show-Up Rate
VIEW CASE STUDY →
Cost per Consult
-68%
dramatic reduction
Booked Consults
+207%
2× qualified lead rate
Healthcare · India

Hair Transplant Clinic — 68% Lower Cost Per Consult

Facebook Ads · Intent Funnel Rebuild · India

-68% Cost Per Consult +207% Booked Consults 55.6% Qual Lead Rate
VIEW CASE STUDY →
+500%
Treatment Volume Growth
Fewer leads · 6× treatments · Canada
-85% cost per treatment
Medical Aesthetics · CA

Canadian Aesthetics — 6× Treatments on Fewer Leads

Facebook Ads · Qualification Funnel · Canada

+500% Treatments -85% Cost Per Treatment +880% Qual Lead Rate
VIEW CASE STUDY →
3.4×
Global ROAS
$25K
Daily Spend
$45→$12
CPC
Global
Market
D2C · Nutraceuticals

Ayurvedic D2C Brand — $25K/Day at 3.4× ROAS

Facebook & Google Ads · D2C · Attribution Overhaul

$25K/Day Spend 3.4× Global ROAS $45→$12 CPC
VIEW CASE STUDY →
$1.5M
Monthly Budget Managed
Scaled from $50K · 30+ ad templates
3,860% budget scale-up
High-Ticket · Coaching

Career Coaching Firm — $50K to $1.5M/Month

Facebook Ads · Creative Scale · Global

$1.5M/Mo Budget 3,860% Scale-Up 30+ Ad Templates
VIEW CASE STUDY →
10-12×
Retargeting ROAS
£2K–£15K AOV · 8-figure revenue
£0.10 CPC achieved
Luxury E-Commerce

Luxury Furniture Brand — 10–12× Retargeting ROAS

Facebook Ads · Traffic Remarketing · £2K–£15K AOV

10–12× ROAS $0.10 CPC 8-Figure Revenue
VIEW CASE STUDY →
Starting ROAS
1.4×
beginning of engagement
Peak ROAS
2.65×
+28% month-on-month
Fashion E-Commerce

Twin Birds — Fashion Brand Scale

Facebook Ads · Aug–Dec 2025

2.65× ROAS ₹23L/mo Revenue +28% Growth
VIEW CASE STUDY →
CPL Reduction
-43%
lower cost, better quality
Video Play Rate
79%
high-engagement creative
Lead Gen · Coaching

Level Up For Women — Coaching Leads

Facebook Ads · 2025

₹287 CPL 43% Cost Reduction 79% Play Rate
VIEW CASE STUDY →
35
Leads in Week 1
New account · ₹200 per lead · 7-day target
Zero-to-results immediately
Lead Gen · Local

Pest Control Services — Week 1 Results

Facebook Lead Ads · 2025

35 Leads Week 1 ₹200 per Lead 7-Day Target Hit
VIEW CASE STUDY →
Initial ROAS
1.4×
before account rebuild
After PMax Rebuild
3.2×
-40% CPA reduction
Google Ads · E-Commerce

D2C Brand — Google Shopping Scale

Google Ads · Performance Max

3.2× ROAS 40% CPA Reduction
VIEW CASE STUDY →
£42
Cost per Lead
180+
Leads/Month
B2B
Sector
UK
Market
Facebook Ads · B2B

B2B Consulting — LinkedIn + Meta Leads

Facebook Ads · UK Market

£42 CPL 180+ Leads/Month
VIEW CASE STUDY →
Before Audit
$90
cost per trial signup
After Rebuild
$18
5× trial volume · -80%
Google Ads · SaaS

SaaS — Trial Acquisition via Google

Google Ads · Search Campaigns

$18 per Trial 220% ROAS Improvement
VIEW CASE STUDY →
Insights

Performance marketing
insights. No fluff.

Practical, field-tested insights from campaigns managing millions in real ad spend — every week.

All Articles

Facebook Ads Strategy

Why 'Ugly Ads' Outperform Beautiful Ones Every Single Time

We ran a 90-day creative test across a fashion e-commerce brand. The polished, studio-shot ads lost to raw, unfiltered content every single time. Here's why.

Mar 2026 8 min read →
Creative Testing

Creative Testing 101: The Framework I Use to Find Winning Ads Fast

Stop guessing. Start testing. Here's the exact creative testing system we use across every client account to identify winners in under 7 days.

Nov 2025 6 min read →
Scaling

The Sneak Attack Method: How to Supercharge Facebook Ad Performance Mid-Campaign

A counter-intuitive scaling strategy we use to boost ROAS on campaigns that have plateaued — without resetting the learning phase.

Oct 2025 5 min read →
E-Commerce

Scaling From $5K to $60K Monthly Ad Spend: What Changes and What Doesn't

The tactics that work at $5K/month break at $60K. Here's what you need to change — and what remains the same — as you scale.

Sep 2025 8 min read →
Lead Generation

How We Generated 35 Leads in Week 1 for a Local Business at ₹200 Each

A complete breakdown of the campaign structure, ad creative, and audience targeting that made this possible from day one.

Aug 2025 5 min read →
Attribution

Last-Click Attribution Is Lying to You. Here's What to Do About It

Most businesses are making budget decisions based on broken data. Here's how to build an attribution model that actually tells the truth.

Jul 2025 7 min read →
Copywriting

The Ad Copy Formula That Cuts Our Cost Per Lead by 40% Consistently

We've tested hundreds of copy frameworks. One pattern repeats in every winning ad we've ever written. Here it is.

Jun 2025 4 min read →
Meta Ads Updates

9 Meta Ad Updates That Are Changing How We Run Campaigns Right Now

Not all platform updates are equal. These 9 changes from the past month actually require you to rethink your campaign structure.

Apr 2026 6 min read →
Facebook Ads Strategy

Why 94% of Facebook Ads Fail — And What the 6% Do Differently

After managing hundreds of ad accounts, the failure patterns are always the same. Here is what separates the winners.

Feb 2026 8 min read →
Scaling & Growth

The Facebook Ads Scaling Mistake 97% of Businesses Make

You doubled the budget and the ROAS collapsed. Here's exactly why — and the right way to scale without destroying efficiency.

Dec 2025 7 min read →
Facebook Ads Strategy

I Managed £5M in Facebook Ad Spend. Here's What Actually Moves the Needle.

A decade of managing millions in ad spend distilled into the things that genuinely determine whether accounts succeed or fail.

Nov 2025 9 min read →
Lead Generation

Stop Getting Junk Leads: How to Attract Premium Buyers with Meta Ads

Scaling lead volume is easy. Scaling lead quality is the hard part. Here's the framework that changes the ratio dramatically.

Nov 2025 6 min read →
Testing & Optimisation

Why I Never Use Facebook's Built-In A/B Testing Tool

Meta's A/B test sounds rigorous. In practice, it costs time and budget that most accounts cannot afford. Here's what works better.

Oct 2025 5 min read →
Get In Touch

Let's find out if we're
the right fit for each other.

We don't work with everyone — we work with businesses where we're confident we can deliver. Apply below and we'll review your application within 48 hours.

Apply to Work With Us

All fields are required. We'll get back to you within 48 hours.

Contact Information

Email
contact@bawejamedia.com
Website
bawejamedia.com
Based In
India · Working Globally
Response Time
Within 48 hours

India & Global

Serving clients across UK, US, Canada, Australia, India & GCC

Follow Us

    How We Got There

      Ready to See Results Like This?

      Let's build your profitable ROAS story.

      We take on a limited number of new clients each quarter. Apply now to see if we're a fit.